Steps For Installation of Magento Google Analytic Enhanced
- Download the zip from Magento store & unzip into a folder.
- After unzip, following files/folders will be extract as shown in below screen:
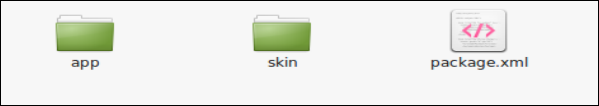
- Login via FTP & Drag drop all the folders into your server root directory.
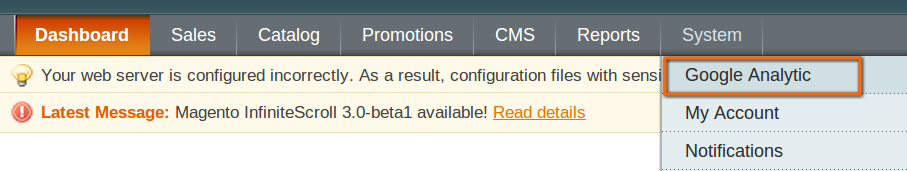
- You will find the extension link will be displayed under System >> Google Analytic.
Google Analytic User Manual
This module will basically work and visible in administration panel. There is no interaction of customers with this module and only administrator has access of this module.After copy this module, a link to access this module will be displayed under System >> Google Analytic menu as shown below screen:
 After clicking on this link, module page will be open as shown in below screen: There are following tabs are displaying on left side in above screens. Each tab has different functionality which are described below in details:
General Settings
On clicking the module link, this tab will be open by default as shown as above screen. This tab has setting of this module. Each setting is explained below:
- Activate: This setting will enable/disable the working of this module. There is switch button to ON/OFF this module. By default, it will be turn OFF.
- IP Anonymization: This setting will enable/disable the IP Anonymization feature .The IP Anonymization feature in Google Analytic sets the last octet of IPv4 user IP addresses and the last 80 bits of IPv6 addresses to zeros in memory shortly after being sent to the Google Analytic Collection Network. The full IP address is never written to disk in this case.
- Display Features: This setting will enable/disable the Display feature in Google Analytic.
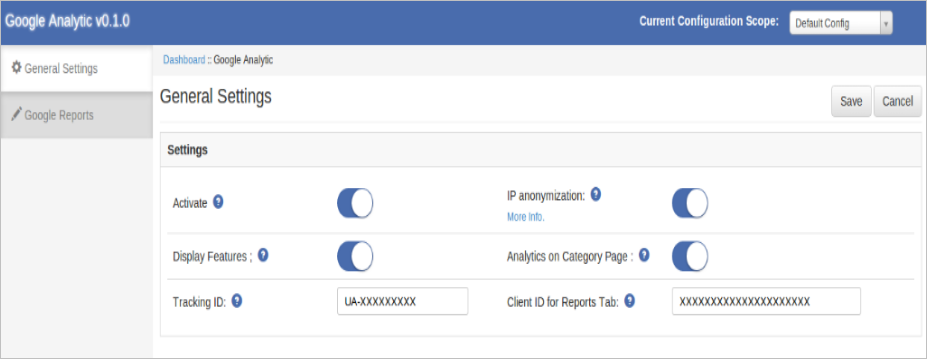
- Analytic on Category Page: This setting will allow you to enable/disable the analytic code to be execute on category page or not. By enabling this setting page speed may slow down depends on the no. of products . If you are using some ajax based 3rd party plugin for loading products. Then turn off this setting and add analytic code manually. To add code manually please refer to Appendix-1.
- Tracking ID: Provide the Tracking Id provided in Google Analytic account.
- Client Id : Provide the Google client Id of the same account associated with Google analytic with auth API and Analytic API .
NOTE: During Google API Configuration for client id , add ANALYTIC API in Google project . In javascript origin add url : https://www.example.com and in Redirect Url add url https://www.example.com/index.php/googleanalytic/adminthml_index/index
Google Dashboard
This tab will display following some Google Analytic reports . On clicking this tab screen will look like following:

Initially this tab will show blank above orange colored login strip and blank report sections . On click of the above orange strip a browser window will open for login into Google Account. Enter the credentials of your account associated with Google Analytic.
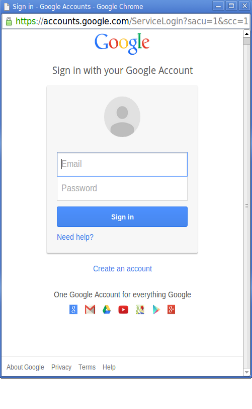
After successfully login , you will see View Selector Options as shown below.
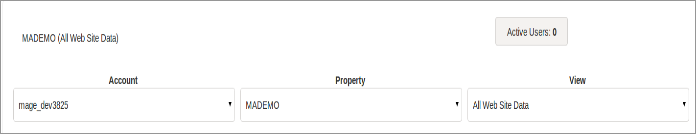
Using these options you can select select your analytic account and its corresponding property and its view.
On the top right there is widget displaying Active users count i.e. No of users currently present on your selected website at that time. By selecting a view reports will be displayed in their sections as shown below:
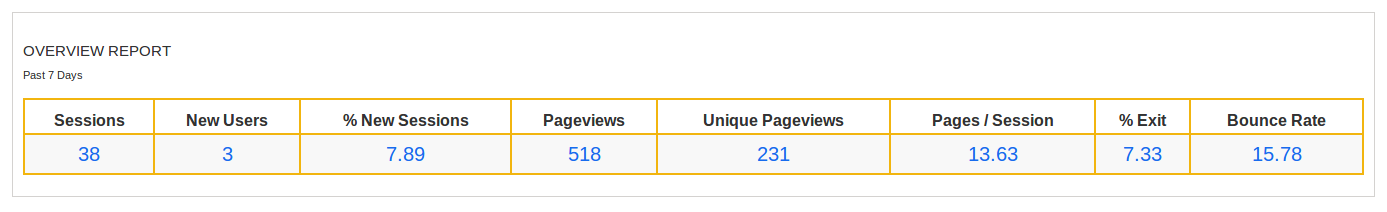
- Overview Report: This is overview report which will display: a)No. Of sessions , b) No. Of New Users, c) Percentage of new Sessions, d) No. Of page views , d) No. Of unique page views , e) Pages per session , f) Exit Rate and g) Bounce Rate of Past 7 days including current day. This report will be displayed in tabular form.
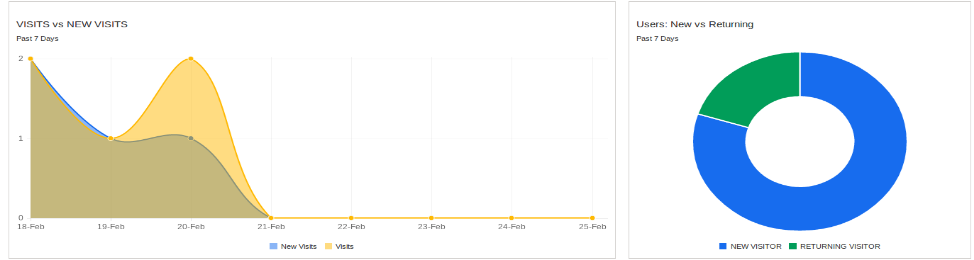
- Visits vs New Visits: This report will display date-wise trend between visits i.e. Total sessions .and New Visits i.e. New Sessions.
- New Users vs Returning Users: This report will pie chart between New Users and Returning Users.
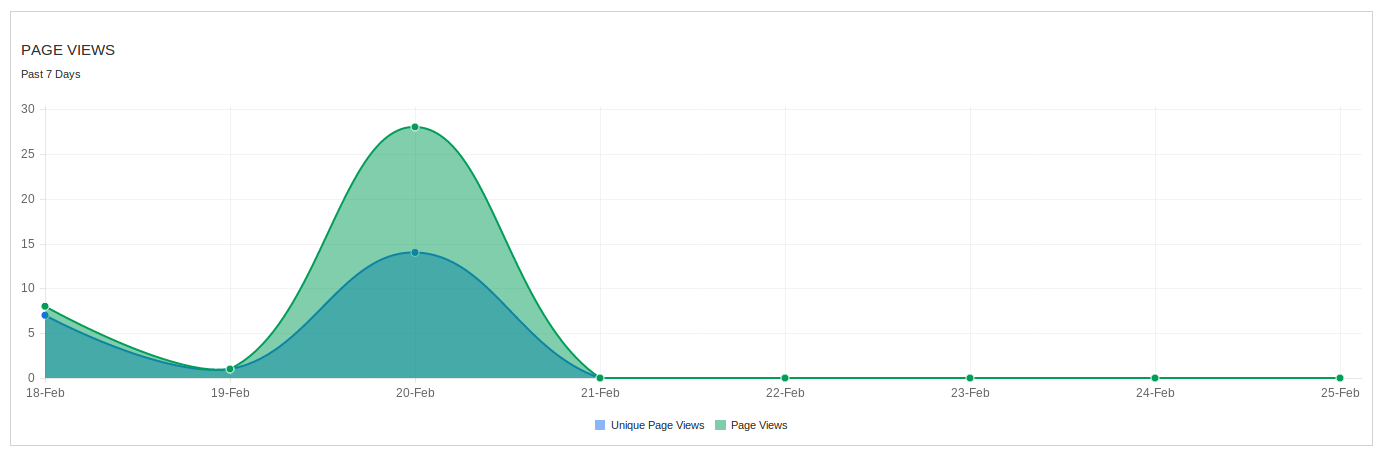
- Page Views Report : This report will date-wise trend between Total page views and Unique page views of past 7 days.
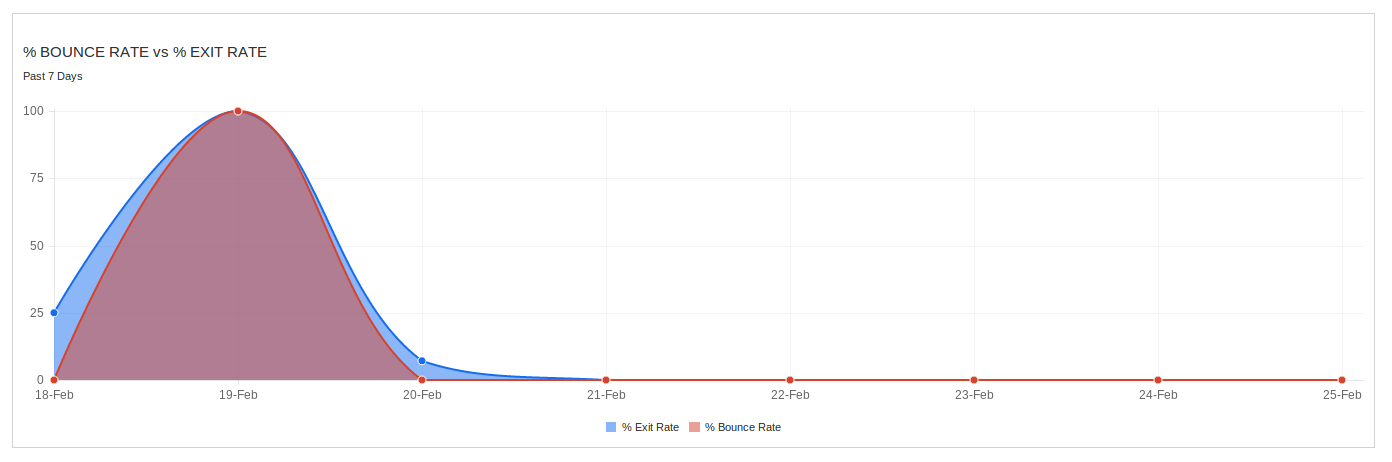
- Bounce Rate vs Exit Rate: This report will display date-wise trend between Bounce Rate percentage and Exit Rate Percentage for past 7 days.
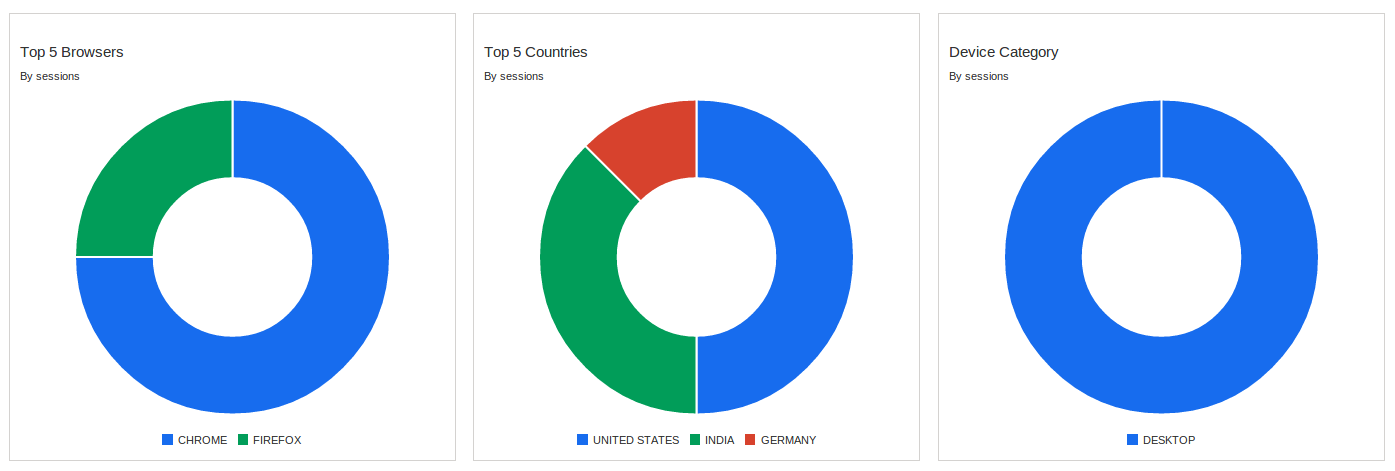
- Top 5 Browsers : This report will display pie chart for 5 most used browsers in past 7 days by sessions . You can see no of sessions per browser on hover pie chart.
- Top 5 Countries: This report will display pie chart for top 5 countries by sessions in past 7 days. You can see no of sessions per country on hover pie chart.
- Device Category : This report will display pie chart for device category like desktop , Tablet or mobile used in past 7 days by sessions. You can see no of sessions per device category on hover pie chart.
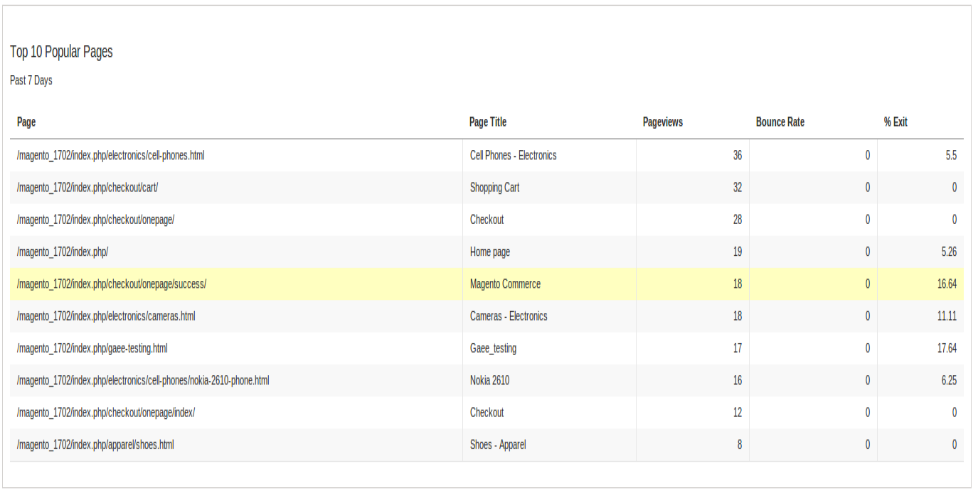
- Top 10 Popular Pages : This report will display top 10 popular page by pageviews from past 7 Days with their Name, Path , Page views count , Bounce Rate(%) and Exit rate(%).
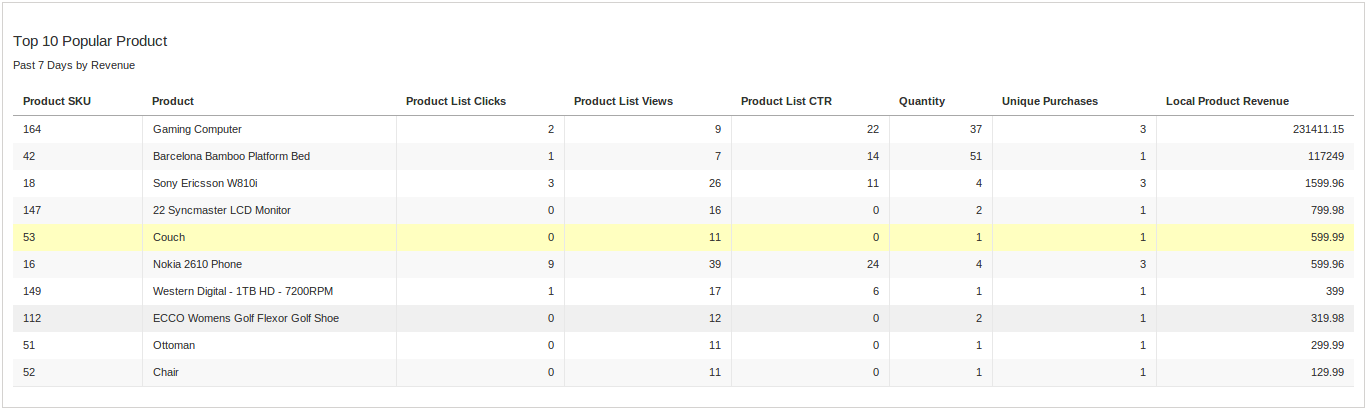
- Top 10 Popular Product : This report will display top 10 popular products by revenue with their SKU, Name, Product List clicks , Product List CTR , Quantity , Unique Purchases, Local Product Revenue.
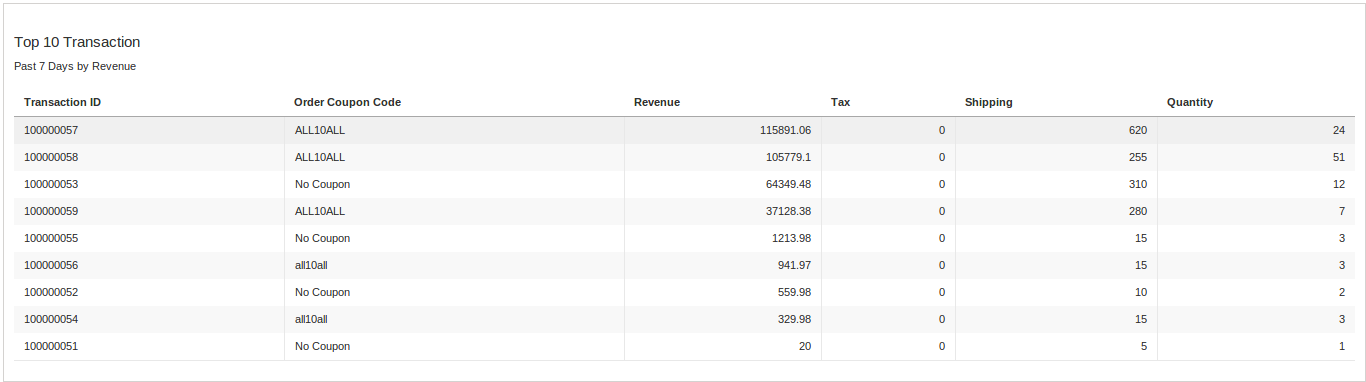
- Top 10 Transactions: This report will display top 10 Transaction of past 7 days by revenue with their Transaction Id, Order Coupon Code, Revenue, Tax, Shipping , Quantity.
Appendix-I
In Magento when a category page is loaded an event is dispatched carrying information about the products. On the basis of that information our code works. But if you are using any extension to load products on category page then you have to manually add the analytic code.
Following is the example analytic code for category page:
ga(“create”, “UA-XXXXX-Y”);
ga(“require”, “ec”);
ga(“ec:addImpression”, { “id”: “9bdd2”, “name”: “Compton T-Shirt”, “price”: “44.00”, “brand”: “Compton”, “category”: “T-Shirts”, “position”: 0, “list”: “homepage”});
ga(“send”, “pageview”);
Details:
In 1st line replace UA-XXXXX-Y with your tracking id. Repeat 3rd line for each product come up with Ajax call to add impression of each product.
In 3rd line there are various field for data to send for analysis following are list of field with their meaning:
A. id=> product id
B. name=> name
C. price=> Product price
D. brand=> products manufactuter
E. category=> product category
F. position=> product position or you can give array index or any sequence no.
G. list => name of list or current page title which is suitable and easy to identify in analytic reports .
Liked This? You’ll Like These Too