Steps For Installation of Magento Bird View Analytic Extensions
1. Download the zip from Magento store & unzip into a folder.
2. After unzip, following files/folders will be extract as shown in below screen:

3. Login via FTP & Drag drop all the folders into your server root directory.
4. You will find the extension link will be displayed under System >> Bird View Analytic.
Admin Module
This module will basically work and visible in admin panel. There is no interaction of customers with this module and only admin has access of this module.
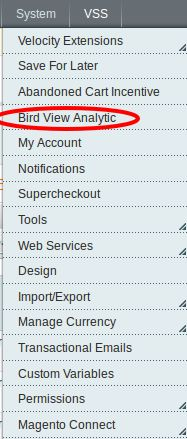
After copy this module, a link to access this module will be displayed under System >> Bird View Analytic menu as shown below screen:
After clicking on this link, module page will be open as shown in below screen:
 There are following tabs are displaying on left side in above screens. Each tab has different functionality which are described below in details :
General Settings
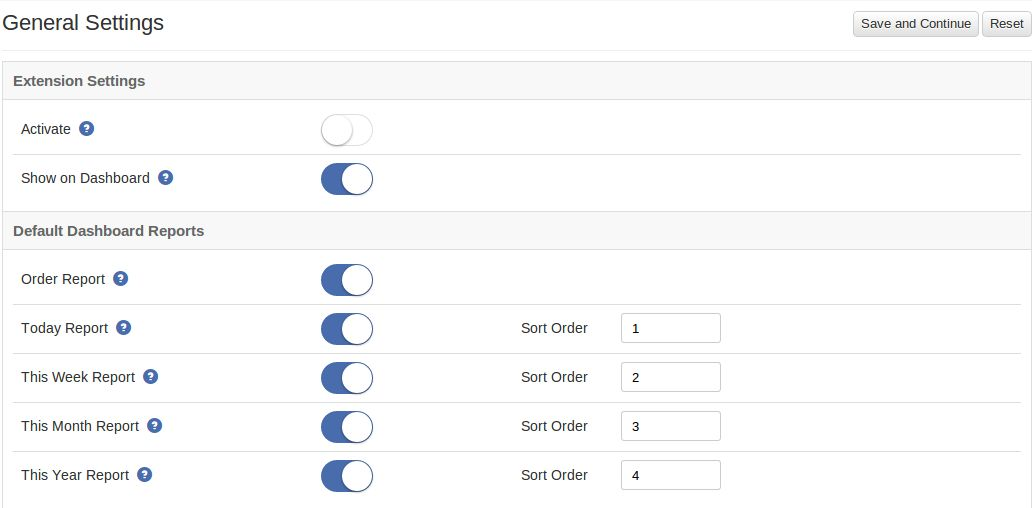
On clicking the module link, this tab will be open by default as shown as above screen. This tab has setting of this module. Each setting is explained below:
Extension Settings
1. Activate: This setting will enable/disable the working of this module. There is switch button to ON/OFF this module. By default, it will be turn OFF.
2. Show on Dashboard: This setting will be used for display following reports on dashboard.
a) Order report
b) Today report.
c) This Week report
d) This Month report
e) This Year report
This setting will display/hide all the above reports. By default, this setting will be ON.
Default Dashboard Reports
This section has for configure settings for dashboard reports.
1. Order Report: Display/hide report on dashboard. By default, this will be ON.
2. Today Report: Display/hide report on dashboard. By default, this will be ON. Admin can also set order of this report.
3. This Week Report: Display/hide report on dashboard. By default, this will be ON. Admin can also set order of this report.
4. This Month Report: Display/hide report on dashboard. By default, this will be ON. Admin can also set order of this report.
5. This Year Report: Display/hide report on dashboard. By default, this will be ON. Admin can also set order of this report.
Report Interval Settings
Here admin can set time interval for reports for which he/she wants to display initially. There are various time interval which will be displayed in dropdown list with each report. These time interval are:
1. Last 7 Days
2. Last 15 Days
3. Current Month
4. Last Month
5. Current Year
Admin can set time interval for various below reports:
1. Dashboard Order Report
2. Sales by catalog
3. Mostly Viewed Items
4. Sales by Time
5. Sales by Customer Group
6. Sales by Country
Dashboard Statistics
This tab will display all those reports which will be displayed on dashboard. There will be no impact of dashboard report settings on this tab. On clicking this tab, following report will be displayed as shown in below screen:
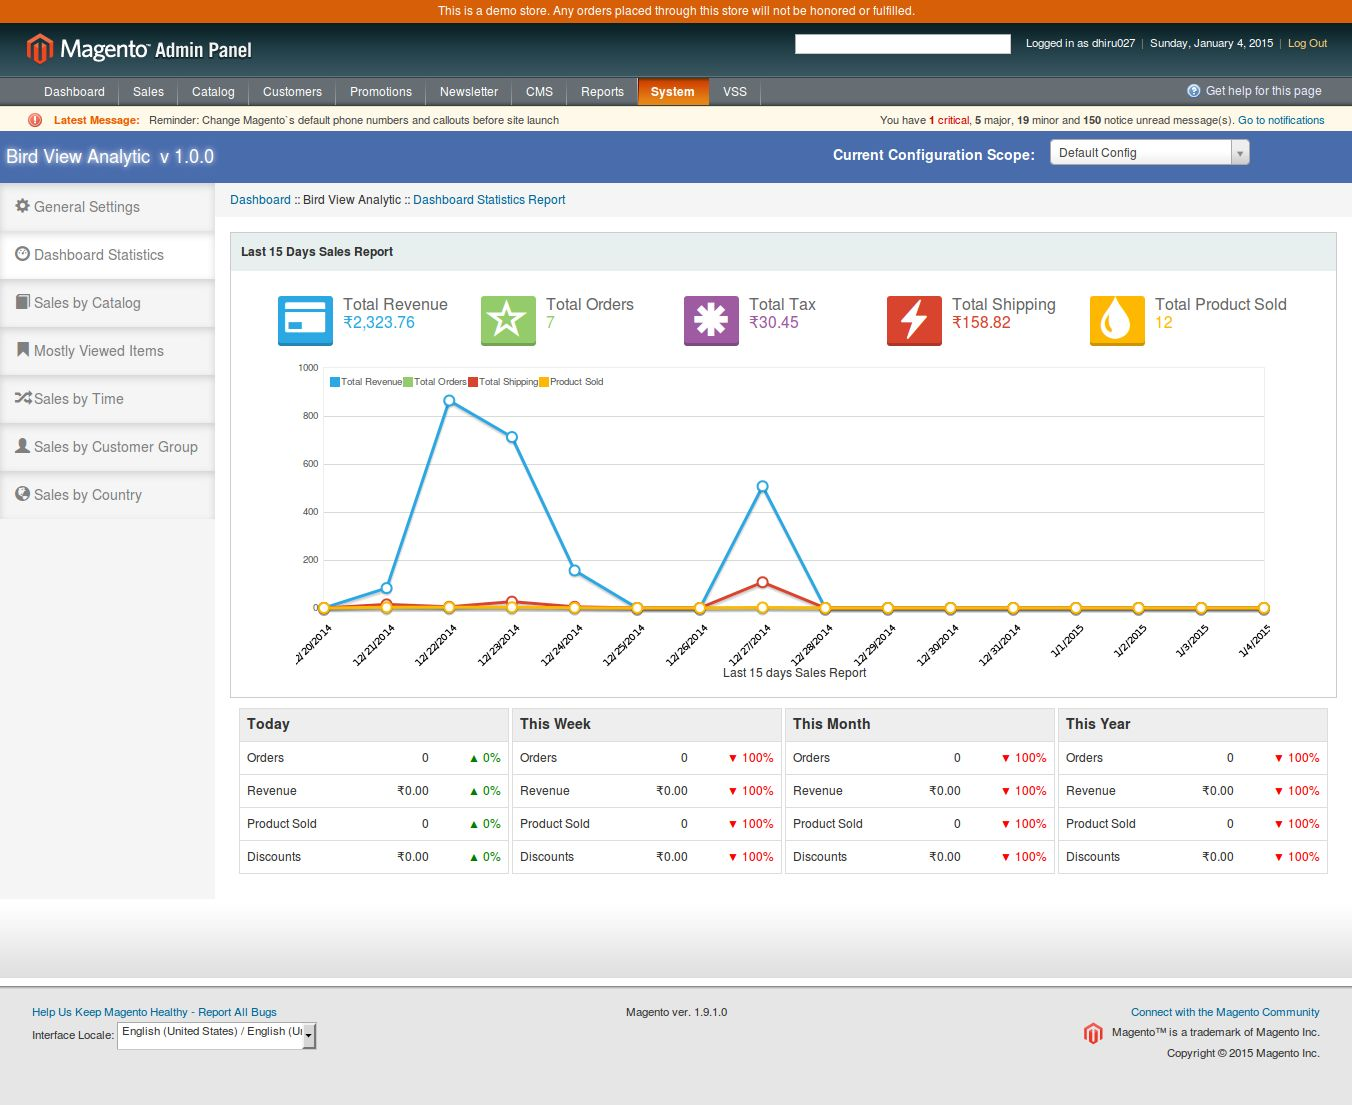
1. Order Report: This is sales report which will display:
a)Total Revenue, b) Total Orders, c) Total Tax, d) Total Shipping and e) Total Product Sold. This report will be displayed in graphical form.
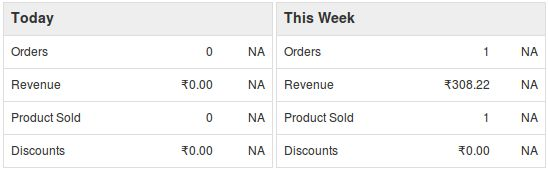
2. Today Report: This report will display today report. The percentage parameter will show the percentage increase/decrease in corresponding parameter after comparing with previous day.
3. This Week Report: This report will display this week report. The percentage parameter will show the percentage increase/decrease in corresponding parameter after comparing with previous week.
4. This Month Report: This report will display this month report. The percentage parameter will show the percentage increase/decrease in corresponding parameter after comparing with previous month.
5. This Year Report: This report will display this year report. The percentage parameter will show the percentage increase/decrease in corresponding parameter after comparing with previous year.
Report from point 2 to 3 will display following parameters:
1. Orders
2. Revenue
3. Product Sold
4. Discounts
On hovering any percentage value, module will display corresponding parameter values with previous value as shown in below screen:
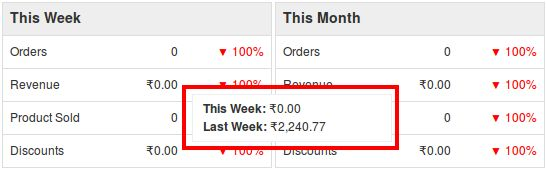
If the previous value of any parameter is 0, then module will display N/A label instead of displaying percentage increase/decrease as shown in below screen:
Sales By Catalog
Here admin can see product sold report as well as category report according to selected report type. By default, module will display sales by product report as shown in below screen:
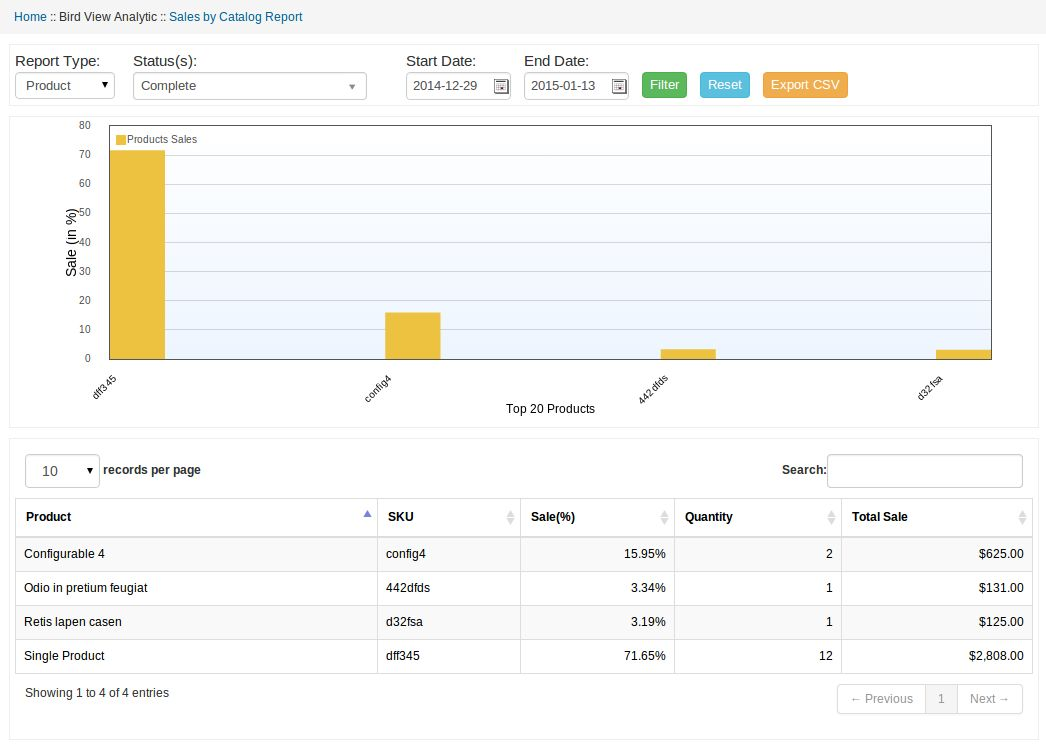
Admin can also filter the report by selecting following parameters in filter option:
1. Report Type: This will be a drop down list which has two options: a) Product and b) Category. With this option, module will display report accordingly. By default, product type will be selected.
2. Status: This will be a drop down list which will display all the order status.
3. Start Date: Required field. This will be a date field. Module will display report onwards of this date. Initially, module will calculate start date according to saved time interval in general setting.
4. End Date: Required field. This will also be a date field. Module will display report before of this date. Initially, module will calculate end date according to saved time interval in general setting.
5. Reset Button: This action will display corresponding report according to default values.
6. Export as CSV: Export and download report according to filter parameters in CSV format.
Graphical Report
Tabular ReportThis section will display top 20 products/category report in graphical form. The graph will display report according to sale in percentage. X-axis label will display product SKU (in case of product type) and category name (in case of category type) report. And Y-axis show sales in percentage.
Tabular Report
In this section, Product/category report will be displayed in tabular format. There are following columns will be displayed in this table :
1. Product/Category Name
2. SKU(in case of product type report)
3. Sale (in %)
4. Quantity (Number of quantity sold)
5. Total Sale (in money)
Mostly Viewed Items Report
Here admin can see mostly viewed/popular report of products as well as category according to selected report type and date interval. By default, module will display mostly viewed products report as shown in below screen:
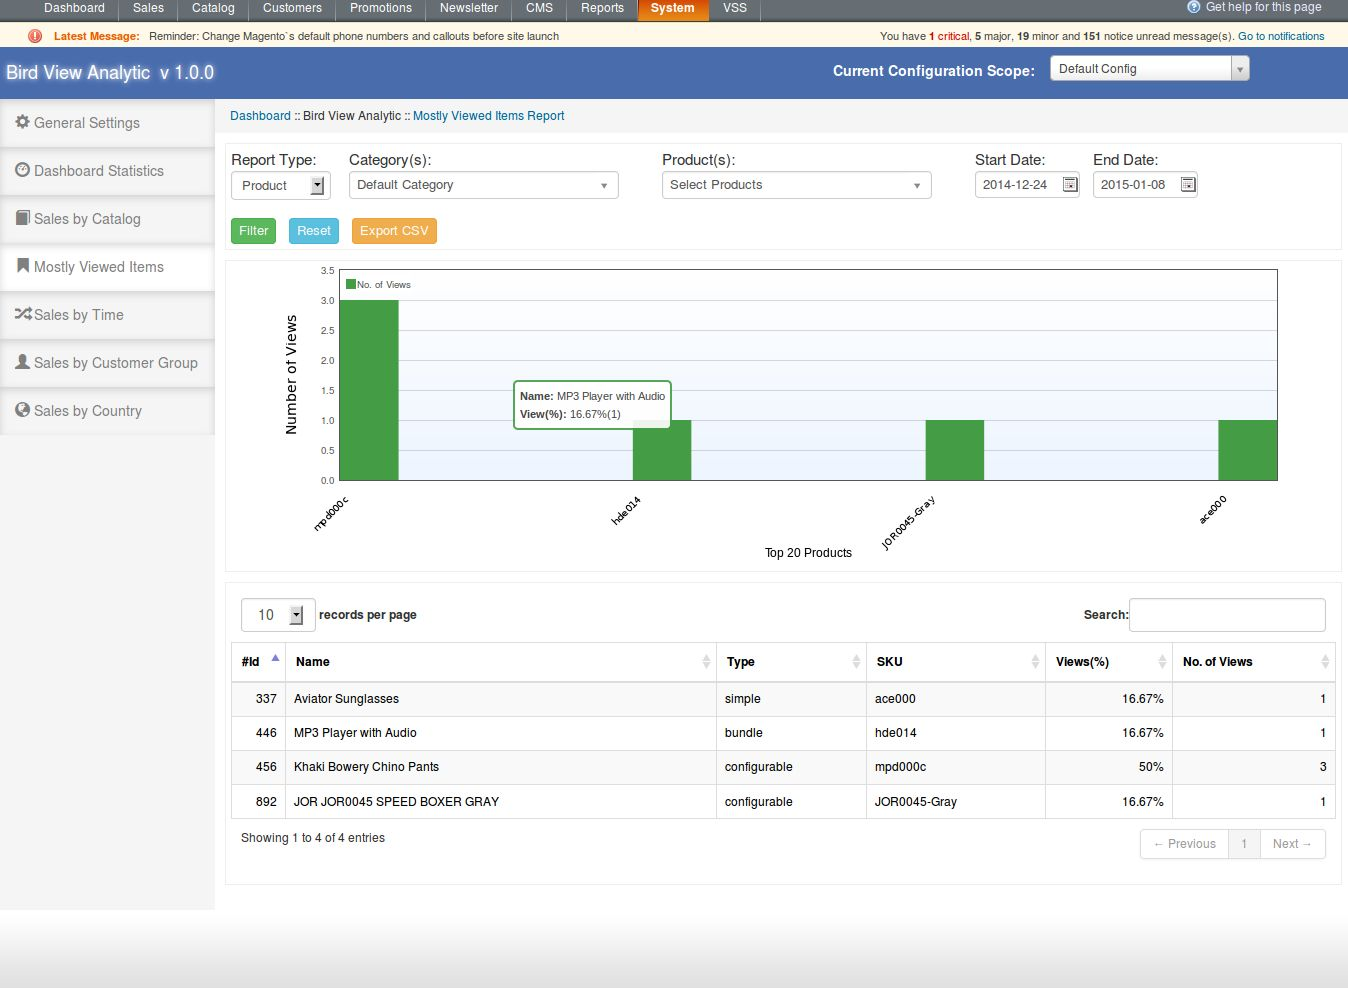
Filter Parameters
Admin can also filter the report by selecting following parameters in filter option:
1. Report Type: This will be a drop down list which has two options: a) Product and b) Category. With this option, module will display report accordingly. By default, product type will be selected.
2. Category List: This will be a drop down list which will display all active category in the system. Here admin can select multiple categories to filter report. By default, all active categories will be listed. Required field incase of report type of category.
3. Product List: This will also be drop down list which will display all the simple type products. Here admin can select multiple products as well as search the product in drop down. On selecting category, module will refresh this product list and display only selected category products. If the report type is Category then this list will be hide. By default, module will display all simple type products and report will be display for all products. Required field in-case of report type of product.
4. Start Date: Required field. This will be a date field. Module will display report onwards of this date. Initially, module will calculate start date according to saved time interval in general setting.
5. End Date: Required field. This will also be a date field. Module will display report before of this date. Initially, module will calculate end date according to saved time interval in general setting.
6. Reset Button: This action will display corresponding report according to default values.
7. Export as CSV: Export and download report according to filter parameters in CSV format.
Graphical Report
This section will display top 20 products/category report in graphical form. The graph will display report according to number of views. X-axis label will display product SKU (in case of product type) and category name (in case of category type) report. And Y-axis show number of views.
Tabular Report
In this section, Product/category report will be displayed in tabular format. There are following columns will be displayed in this tab:
1. Product/Category Id
2. Product/Category Name
3. Product type (in case of product type report):
4. SKU(in case of product type report)
5. Views (in %)
6. Number of views
Sales By Time
In this tab, admin can see sales report according to time. This tab will display 3 types of report as per time. Here time have been divided into following category:
1. Days of Week (Display report for only days of week i.e Monday to Sunday)
2. Months of Year (Display report for only months of year i.e January to December)
3. By Years (Display year report)
By default, module will display days of week report as shown in below screen:

Filter Parameters
![]()
Admin can also filter the report by selecting following parameters in filter option:
1. Start Date: Required field. This will be a date field. Module will display report onwards of this date. Initially, module will calculate start date according to saved time interval in general setting.
2. End Date: Required field. This will also be a date field. Module will display report before of this date. Initially, module will calculate end date according to saved time interval in general setting.
3. Type: This will be a drop down list, which will display following options: a) Days of Week, b) Months of Year and c) By Years. By default, Days of Week will be selected.
4. Reset button: This action will display corresponding report according to default values.
5. Export as CSV: Export and download report according to filter parameters in CSV format.
Graphical Report
This section will display report according selected type in graphical form. The graph will display report according to sale(in money). X-axis label will display day name (in case of days of week type), month name (in case of Months of Year type) and year (in case of By Year type) report. And Y-axis show sales (in money).
Tabular Report
In this section, sales report will be displayed in tabular format. There are following columns will be displayed in this tables:
1. Label:
a) Day name(Monday – Sunday) in case of Days of Week report.
b) Month Name(January – December) in case of Months of Year report.
c) Year (2014, 2015 etc) in case of By Years report.
2. Sale (in %)
3. Total Orders
4. Quantity (Product Sold)
5. Total Sale (in money)
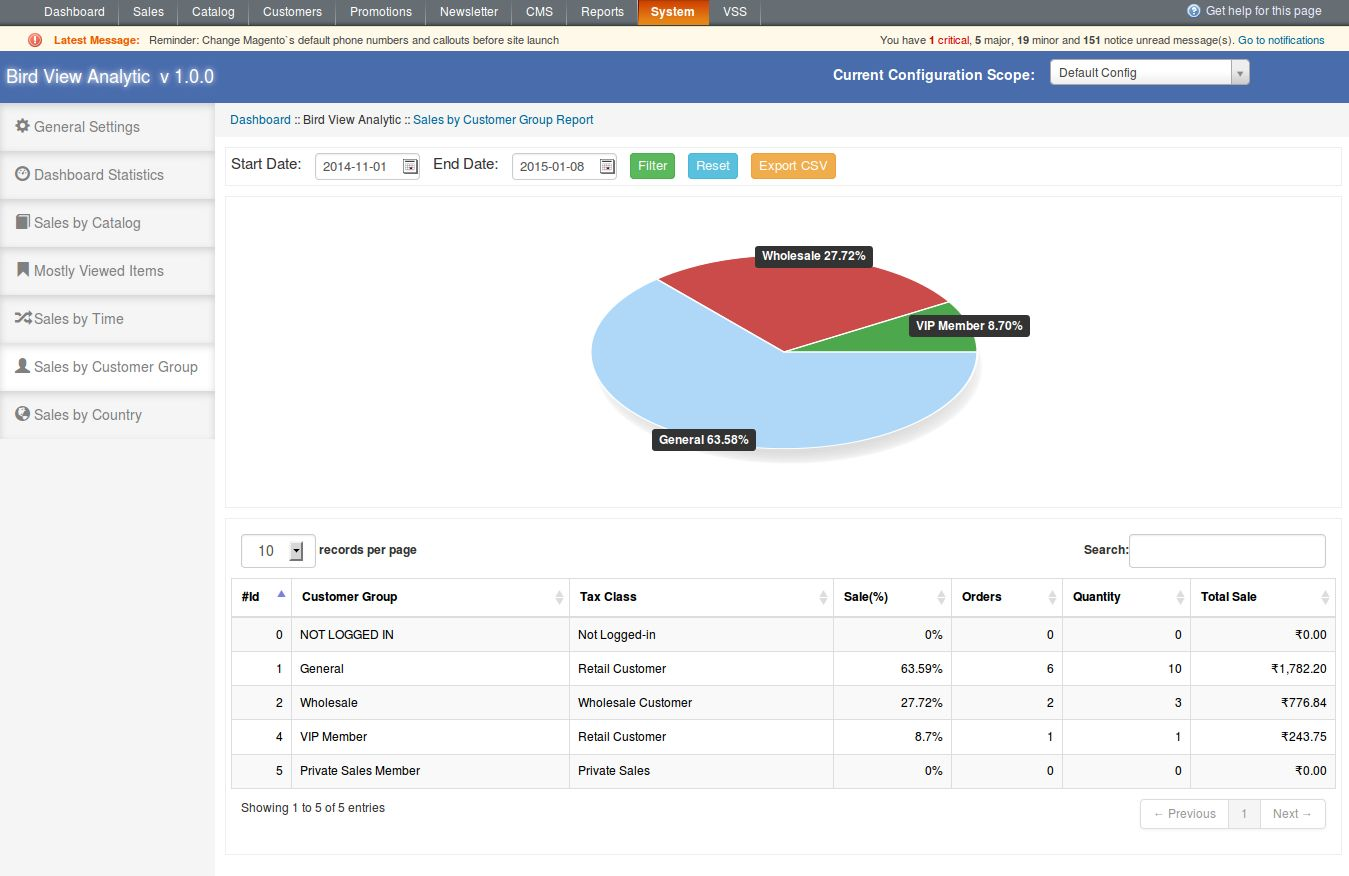
Sales By Customer Group
In this tab, admin can see sales report for each customer group. By default, module will display report according to saved time interval as shown in below screen:
Filter Parameters
![]()
Admin can also filter the report by selecting following parameters in filter option:
1. Start Date: Required field. This will be a date field. Module will display report onwards of this date. Initially, module will calculate start date according to saved time interval in general setting.
2. End Date: Required field. This will also be a date field. Module will display report before of this date. Initially, module will calculate end date according to saved time interval in general setting.
3. Reset button: This action will display corresponding report according to default values.
4. Export as CSV: Export and download report according to filter parameters in CSV format.
Graphical Report
This section will display report according selected type in pie chart. In pie chart, each section will highlight the corresponding sales data in percentage as shown in above screen.
Tabular Report
In this section, sales report will be displayed in tabular format. There are following columns will be displayed in this tables:
1. Group name
2. Tax class name (currently applicable)
3. Sale (in %)
4. Total Orders
5. Quantity (Product Sold)
6. Total Sale (in money)
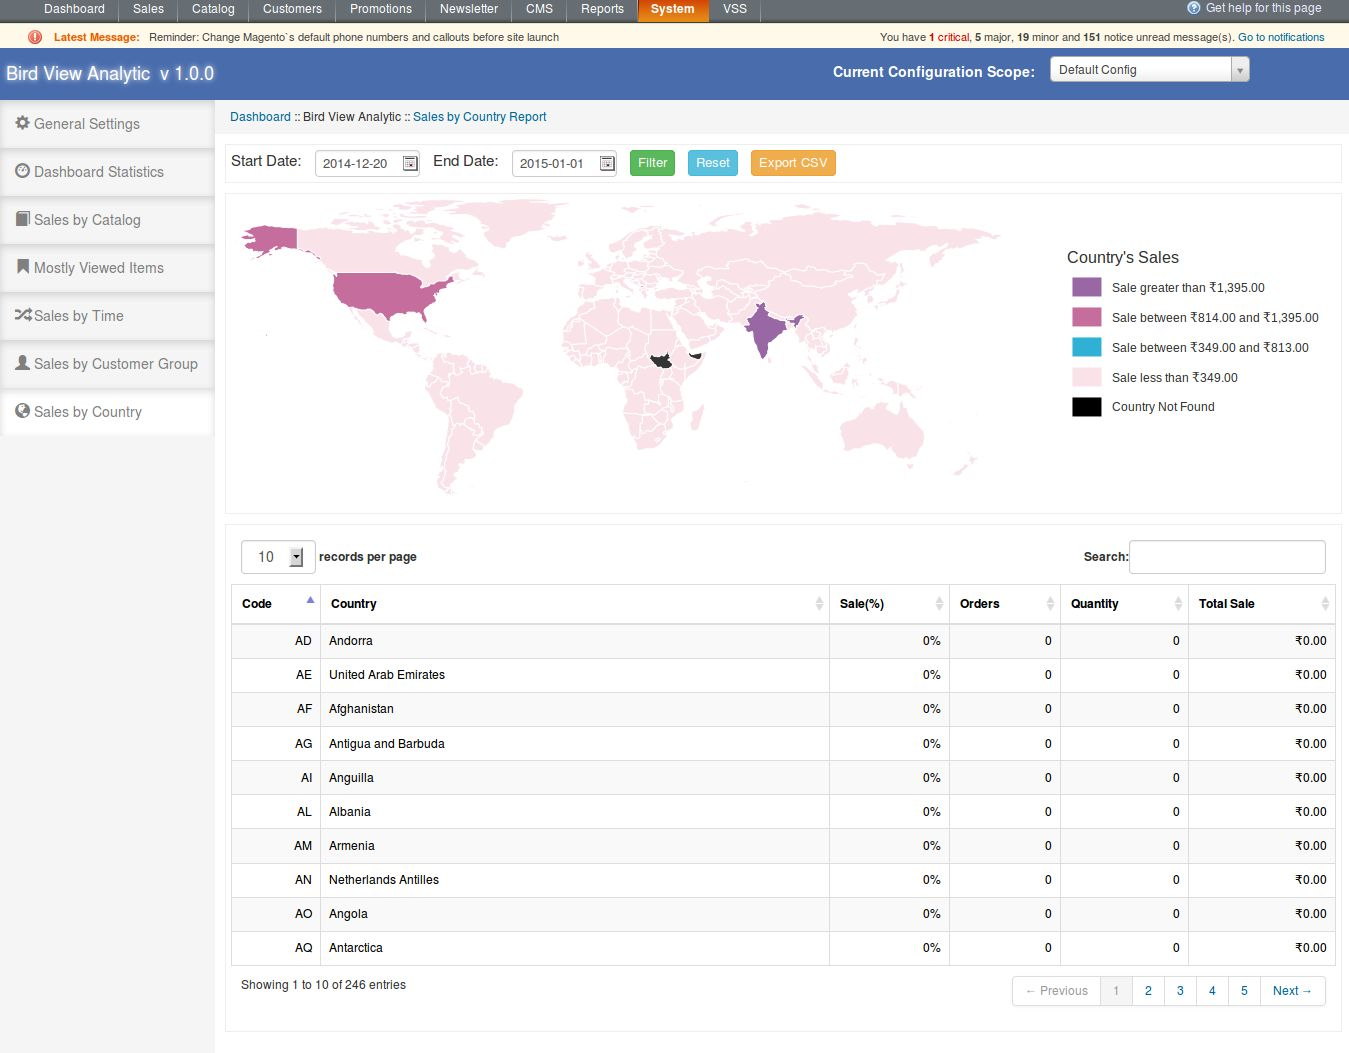
Sales By Country
In this tab, admin can see sales report for each country. By default, module will display report according to saved time interval as shown in below screen:
Filter Parameters
![]()
Admin can also filter the report by selecting following parameters in filter option:
1. Start Date: Required field. This will be a date field. Module will display report onwards of this date. Initially, module will calculate start date according to saved time interval in general setting.
2. End Date: Required field. This will also be a date field. Module will display report before of this date. Initially, module will calculate end date according to saved time interval in general setting.
3. Reset button: This action will display corresponding report according to default values.
4. Export as CSV: Export and download report according to filter parameters in CSV format.
Graphical Report
This section will display report in world graph map. Each country will be highlighted with different color as per sale range. On hovering country, module display country name and sale(in money) from that country.
Sale Range
Sale is divided into 4 range as follow:
1. 1 Range: This range will indicate sale range above 60%.
2. 2 Range: Indiacate range between 35% to 60%.
3. 3 Range: Indicate range between 15% to 35%.
4. 4 Range: Indicate range less than 15%
5. The last one is not range. It will indicate only not found country.
Tabular Report
In this section, sales report will be displayed in tabular format. There are following columns will be displayed in this tables:
1. Country Code
2. Country Name
3. Sale (in %)
4. Total Orders
5. Quantity (Product Sold)
6. Total Sale (in money)
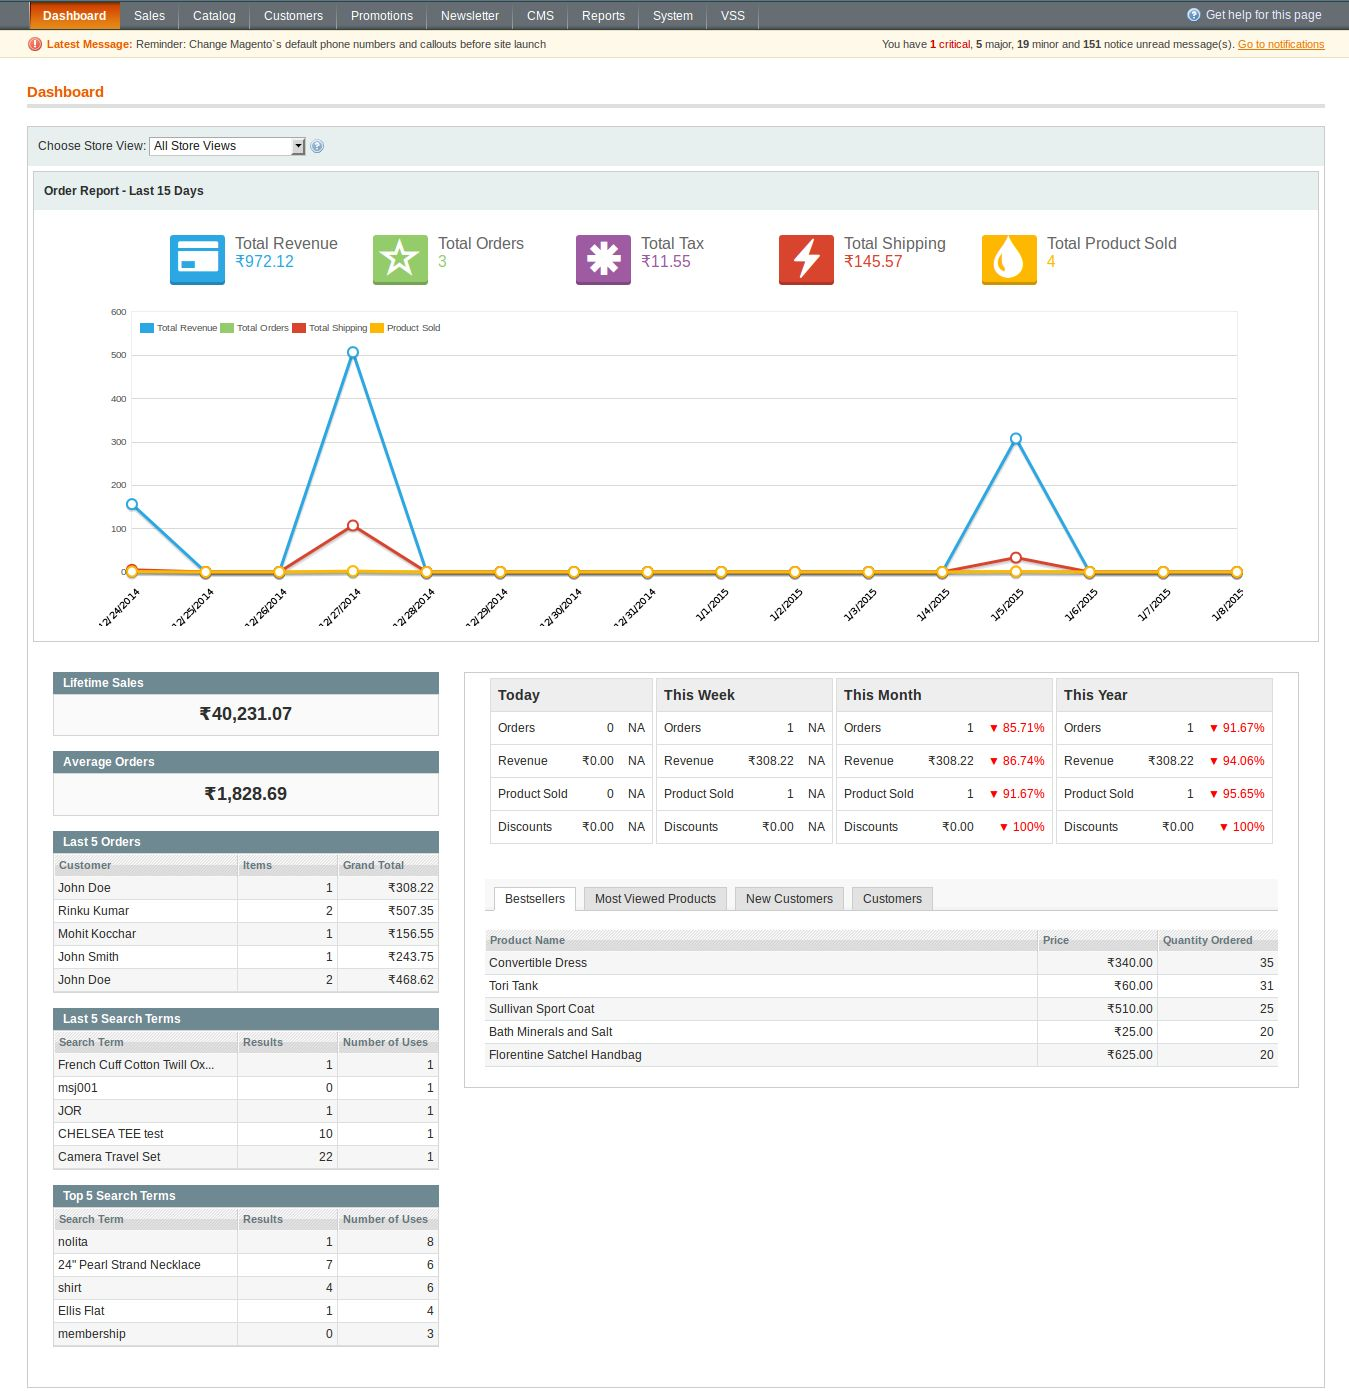
Dashboard Item
If any report is enabled to display on dashboard from general settings, then module will display them on dashboard. The report which will be displayed on dashboard is identical to report displaying in Dashboard Statistic Tab. For example, if all dashboard items are enabled then module will display reports on dashboard as shown in below screen:
Front End
There is no interaction of this module with users on front end. Only one functionality will work internally on front end which does not affect any other part of system.